
LIFE CYCLE ANALYSIS, ACCORDING TO ABM
Published: 27/10/2020
In the article LCA: how to track if you or your suppliers are heading towards sustainable business? on this blog we have seen how the LCA anlysis should be approached to assess the sustainability of an application or activity.
In this further analysis, Marjo Ketonen of ABM’s R&D department provides more insight about the ABM method to calculate materials influence on global warming.
The environmental aspect and climate care are deeply embedded in ABM’s DNA.
The two key indicators in a products’ environmental footprint are greenhouse gases (GHGs) and non-renewable energy use.
In some cases compared to traditional technical plastics the amount of GHGs and use of non-renewable energy (per kg of polymer produced) can be reduced as much as 60-80% by using ABMc compounds. For the final calculation/comparison, the Life Cycle Analysis (LCA) tool should be used.
Arctic Biomaterials approach to LCA
Incorporating a life-cycle assessment (LCA) into research and development is proven to be a valuable method at ABM, as our customers have a strong need to have proof about the sustainability value of the material they purchase and use as sustainable alternative.
In the past, ABM has relied on declarations by its raw material suppliers on environmental declarations. These peer-reviewed environmental claims are only sufficient to a certain point.
ABM purchases bio-based polymers from renewable sources and increases their environmental impact in its own manufacturing process, which produces bioplastics composite by adding bio-glass fibers based on ABM’s own technology.
Through the manufacturing process, ABM increases the environmental impact of a product by using energy and using global raw material supply chains.
In addition to the choice of raw material, these effects have to be computationally added to the carbon footprint estimate to avoid possible unintentional green washing. The LCAs conducted by ABM is based on Environmental Footprint Database 2.0 and by using accredited GaBi (2019) datasets and by following principles and approaches outlined in ISO 14040 and ISO 14044.
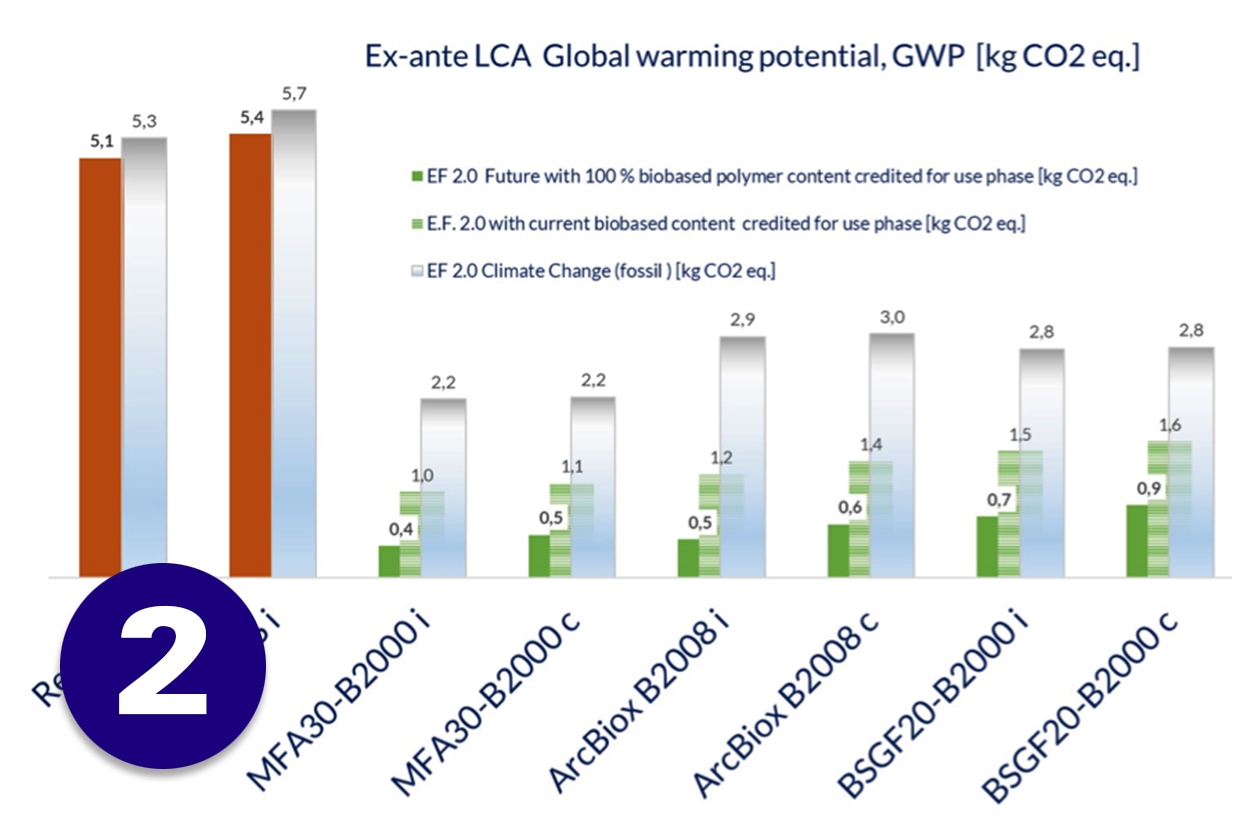
Different what if-material selection scenarios revealed that the manufacturing location and transportation distances effect to the total composite GWP is still being left behind by the material selection impact. If carbon uptake is credited, the GWP of products was significantly lower compared to fossil based PP and ABS.
An example of global warming potential investigation
In a scenario where PLA composite including 30% glass fibre was investigated cradle-to-gate: Polymer share from the GWP was 67%, Glass fibre 19%, Transportation (global) share was 11% and selected production locations electricity grid weigh was 4% from the total GWP of the product. Carbon uptake during raw material feedstock production is -56% share from the GWP giving the bio-based materials an environmental advantage.
Figure below presents an example from what if material selection scenarios for ABM products. Global warming potential from cradle-to-grave, EoL incinerated (i) and composted (c) is compared and Carbon uptake is credited in GWP.
Disclaimer: Results from the calculations above must undergo independent critical review if they are to be used for comparative assertions. This information and all technical and other advice are based on Arctic Biomaterials Oy present knowledge and experience. ABM assumes no liability for such information or advice, including the extent to which such information or advice may relate to third party intellectual property rights. ABM reserves the right to make any changes to information or advice at any time, without prior or subsequent notice.
For more information please contact:
Marjo Ketonen (R&D)
Paris climate agreement
The Paris Agreement is an agreement dealing with greenhouse gas emissions. The aim of the agreement is to limit the increase of global average temperature. China and US have the highest carbon dioxide emission today with China accounting for 29.4% and US for 14.3% of global emissions (ref Wikipedia).
The Paris Agreement has been signed by 159 countries. Check http://unfccc.int/paris_agreement/items/9485.php.
EU climate action targets
EU has set its own challenging targets to reduce emissions and limit global warming. EU targets to reduce GHG (greenhouse gas emissions) below 1990 levels are:
By 2020 reduction of 20%
By 2030 reduction of 40%
By 2050 reduction of 80%
Check: https://ec.europa.eu/clima/policies/strategies/2020_en.
Share the article on your favorite social:
Did you find the article interesting?
 (No Ratings Yet)
Are there any topics you'd like to see covered in this blog?
Your comments and requests are important to us: write them in the space below, it's available to you!